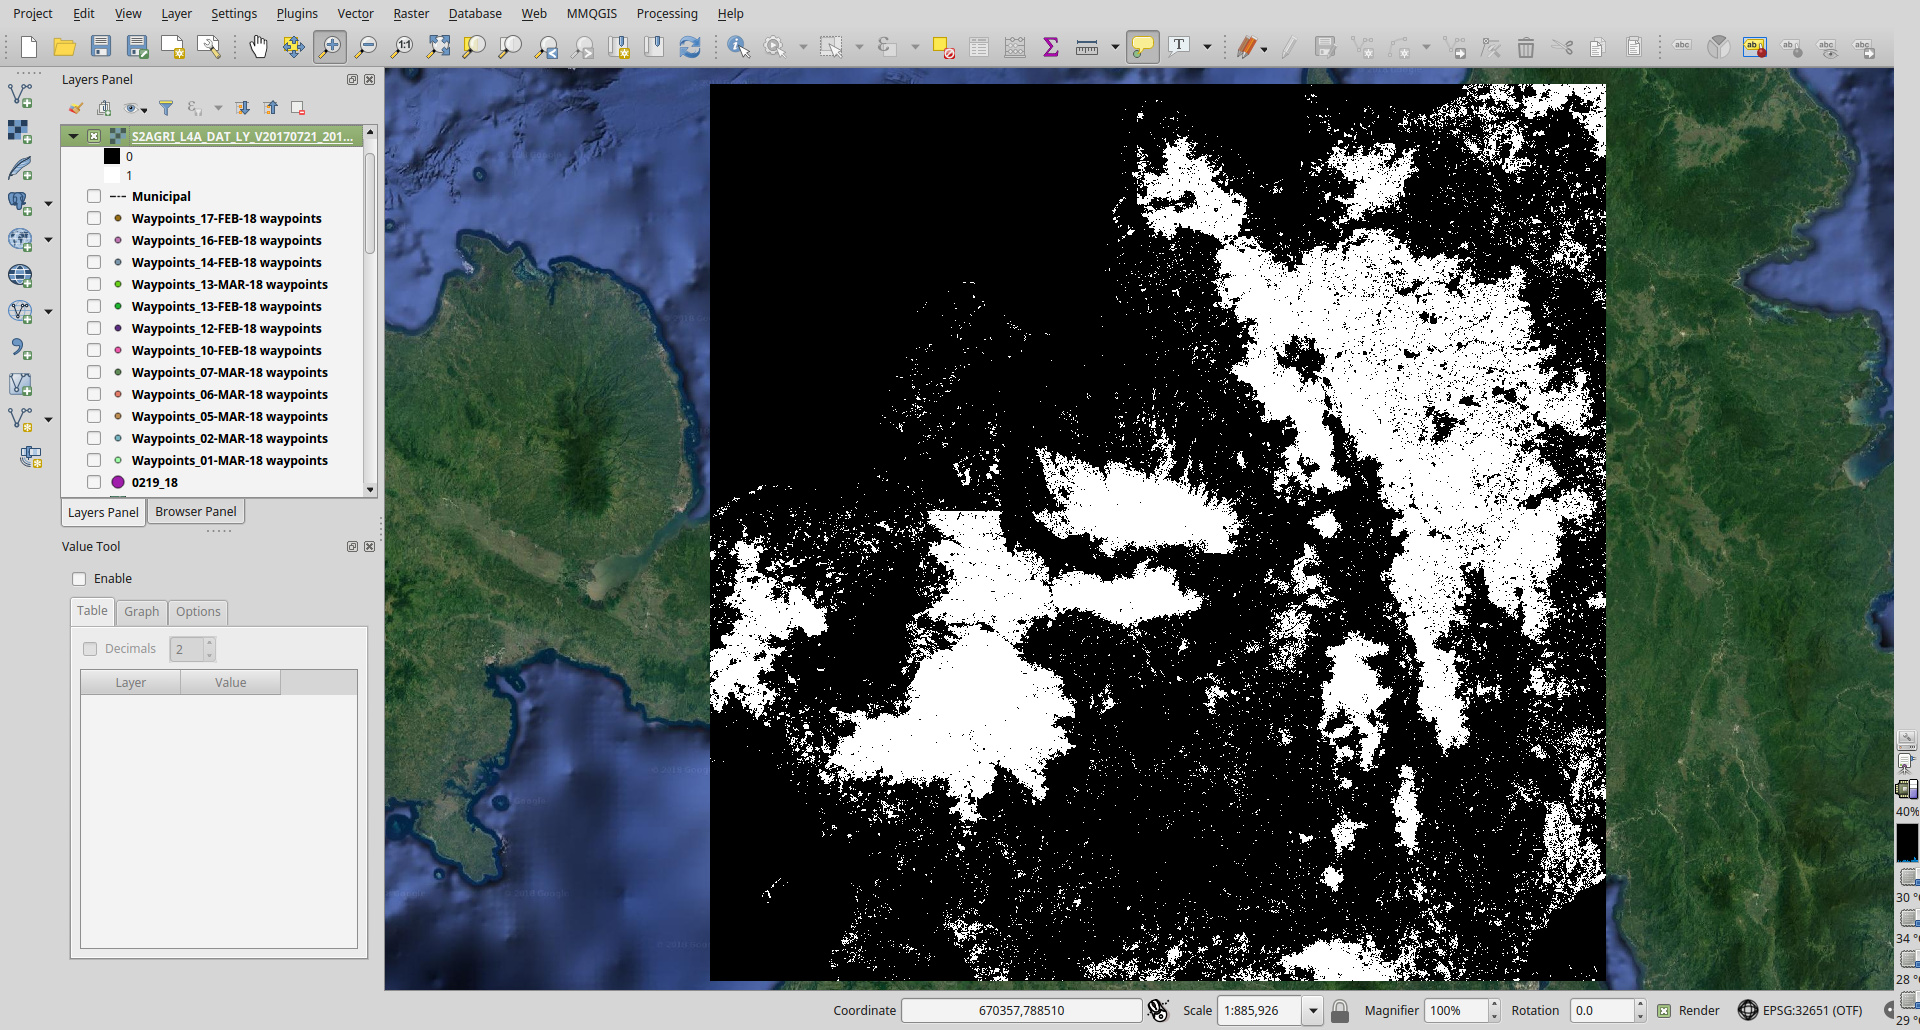
My product is composed of four tiles (UL = 51PXK, UR = 51PYK, LL = 51NXJ, LR = 51NYJ). I find this results very weird and it seemed that the L4A (w/ in situ file) had processing errors/artifacts.
Here, I masked out the perennial classes like forests, rubber trees, etc. but it’s obvious that something went wrong on the upper left tile (the forested areas were chopped in a straight manner).
We’ve seen this effect, but unfortunately I have no solution. It usually happens in regions where there are fewer acquisitions. How many input products are there?
I think the acquisitions for that tile is at least more than 15 since I selected the landsat 8, sen2A and sen2B dates starting July 21, 2017 (the date when sen2b produced its first usable images). Is my estimate correct?
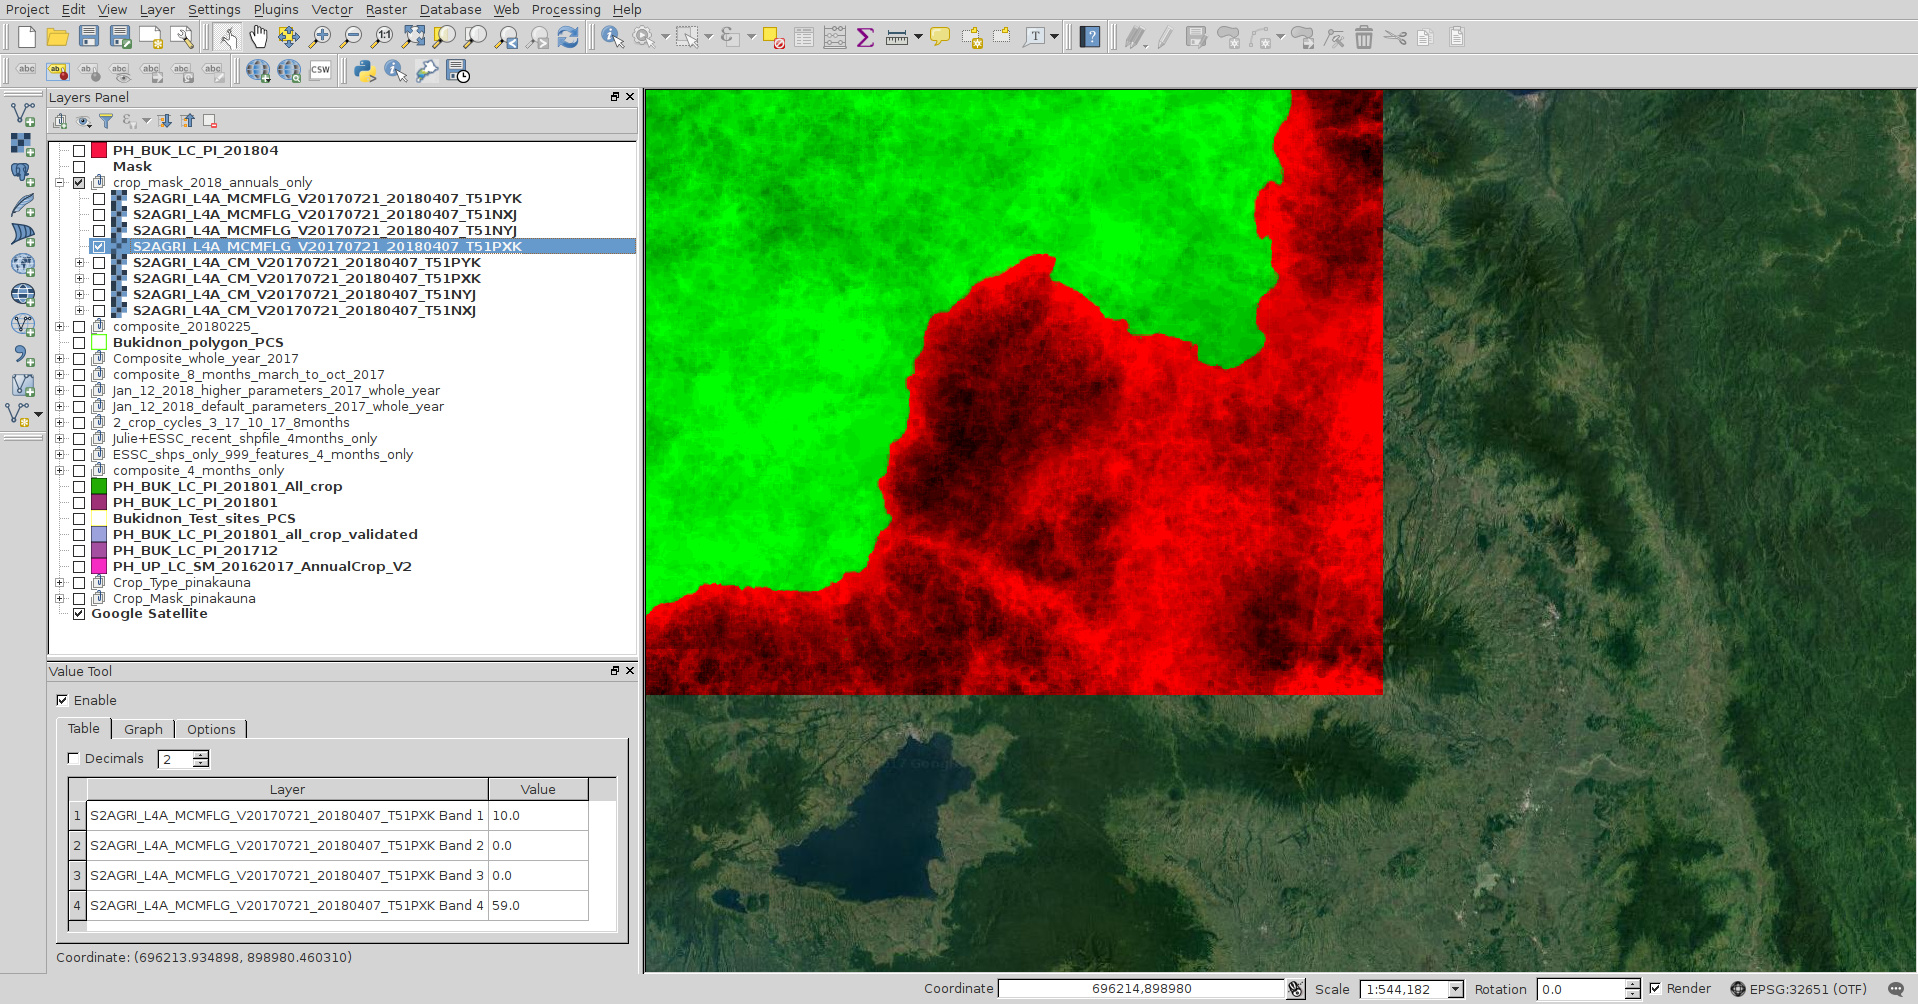
I edited the training shapefile I used for the L4A, and the mask for upper left tile is now ok.
Upon checking the QI info the forested areas, the number of images associated with land is 5-10, while those associated with clouds is about 50 to 60+ images.
Hi,
Yes unfortunatly, Philipines is a very tough area to classify with optical data due to an very persistant cloud coverage.
Good news of the in situ data.
Did you remove the training data from that part of the tile?
@nicolas.bellemans It would probably be best to ignore samples with a lot of clouds during the time series, but right now it’s not too easy to implement that.
No I didn’t remove them I just adjusted the “CROP” fields values of annual crops (rice, corn, sugarcane and other crops) from 0 to 1, the non-annuals were 0.