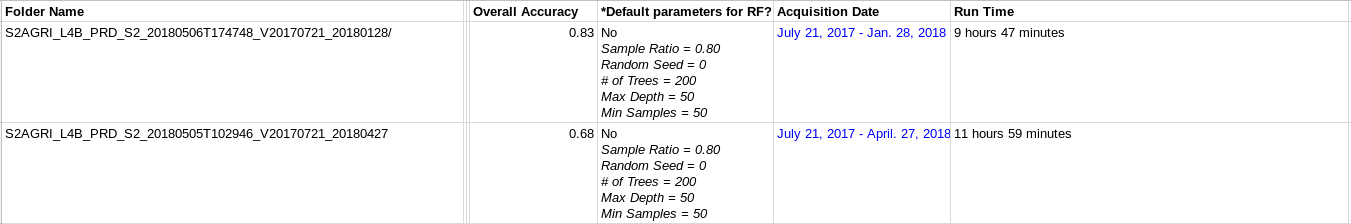
I’m just wondering because it doesn’t make sense that the product with longer acquisition period/date (second row) had a lower accuracy compared with the first row. Should it be the other way around? What’s the reason for this?
Note: The said products used the same vector polygons.
Using more data can introduce noise in the model and lead to lower accuracy. I know basically nothing about your area. Does the longer period span two growing seasons or something like that?
My longer period covers 10 months while the shorter period is about 5 months.
Anyway, I had anotherL4B product that had an accuracy of 0.88 but the random forest parameters are in default mode (Sample Ratio = 0.75, Random Seed = 0, Number of trees = 100, Max Depth = 25, Min Samples = 25). It seemed that there had been over-fitting with the first product.
Sorry for the lare reply, you can see the accuracy in:/mnt/archive/{site_name}/l4b/S2AGRI_L4B_PRD_S5_20180629T014849_V20180102_20180313/AUX_DATA.
All ancillary data are there (in .xml files)
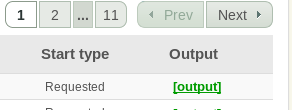
The run time can be seen in the monitoring tab of the web interface, and just click the “output” link of your job, click the “Output” link (in L4B’s case).
Yes, that is right. Well I’m not so sure but you can also based the “correctness” of your output not only from Overall Accuracy, but also from the F-Score, precision and recall values on each class as well.
In addition it greatly depends on the quality/quantity of your in situ/training data (if you’ve used one).
This link could be of great help in understanding the said measures.